How do we estimate residual life across building parts, materials and building types? Here you get the brief explanation of how our lifetime model works, what makes it unique and what improvements we are working on.
What the model does
Our longevity model is a boosted decision tree model (CatBoost) that estimates residual life for all registered building parts.
It draws on 40 different input factors, among them:
- use and age of the building
- square meters
- energy label and type of heating
- population density
- material and quantity for each building part
- any energy improvements
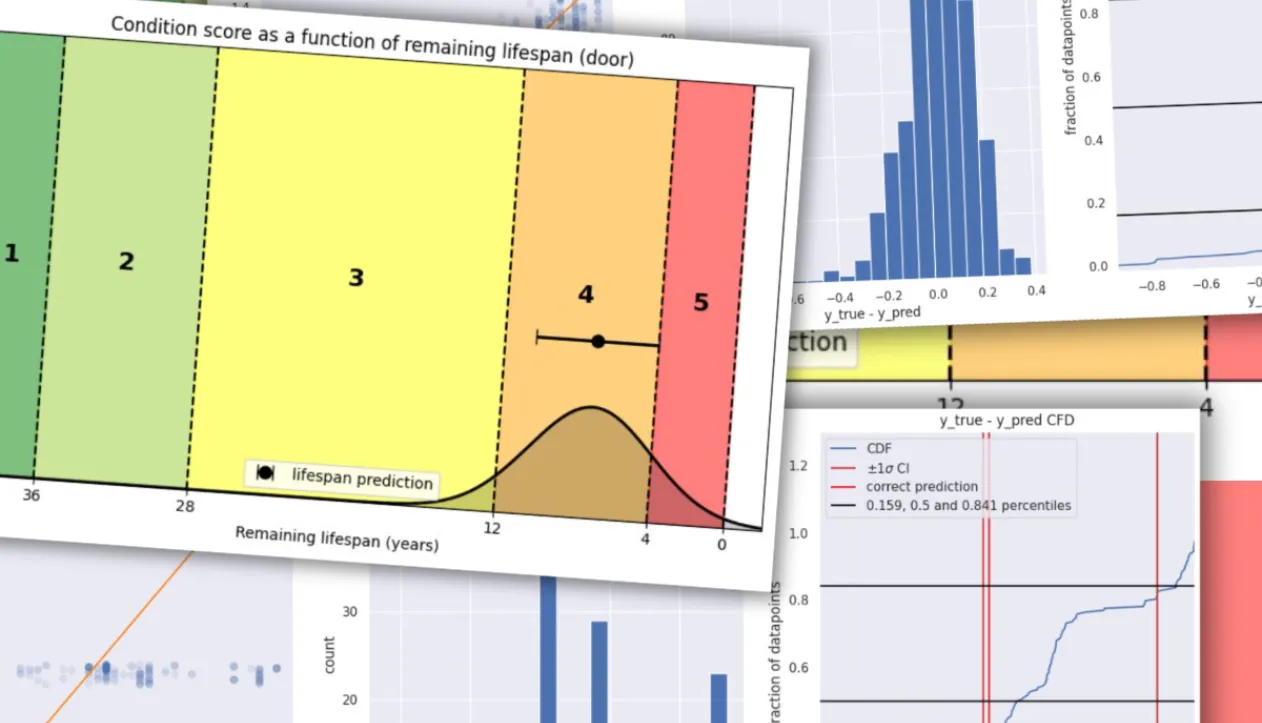
From Lifetime to Condition Score
Once the model has calculated the remaining lifetime, the result is translated into a condition score from 1 to 5. This is done by comparing the model estimate with reference values from the BUILD lifetime tables.
An example: A door with a total service life of 40 years gets:
- Score 1: more than 36 years remaining
- Score 2:36—28 years
- Score 3:28—12 years
- Score 4:12—4 years
- Score 5: less than 4 years remaining
It can make for funny borderline cases. A 15-year-old door can still get condition 1 if the model estimates it has more than 36 years left. But that is precisely the point.
The model learns from real observations how many building parts last longer than the tables dictate.
Security: how confident are we on the estimate
When the model estimates the residual life of a building part, it simultaneously calculates an uncertainty on the estimate. You can think of it as a measure of how much variance there is in the predictions for a building part. A small uncertainty comes from the fact that the predictions are generally correct for a given building part and residual life.
The safety score calculated is the probability that the stand on the building part has been estimated correctly.
One example: If the model estimates that a door is capable four, with a 77 percent certainty, it can be expected to be correct in 77 percent of cases. So there is a if probability that the door is actually stand three or stand five.
By displaying the safety score, we not only provide an estimate of the condition and residual life, but also assess the probability that the estimate is correct. This makes the results more transparent and usable in practice when making decisions based on data.
Why not just two models
Previously, we used one model for longevity and another for condition. It produced inconsistencies, for example when the lifetime model assessed a long residual life, while the state model assessed poor condition.
Now we let the lifetime control the state so that the estimates always correlate. In turn, it requires the translation to become more intelligent, and that is exactly what we are working on.
Low-hanging improvements we're working on
Age correction of score
New building parts should not land in state 2 or 3, and very old ones should not stay in state 1, even if the lifetime estimate is high.
Data-driven calculation of security
Instead of assuming a normal distribution, we let the actual data distribution determine how the security is calculated.
Why this is valuable
Because the model relies on real-world observations from many property portfolios, it reflects reality better than theoretical tables.
The result is:
- More planned maintenance
- Fewer misinvestments
- Lower technical debt
- A more realistic data base for decisions
Want to see how your buildings are doing?


Subscribe to our newsletter
Get insights into new features, customer cases, and news from proprty.ai, delivered straight to your inbox.
%202.webp)
