In connection with the development of the new version of our model to predict building parts maintenance costs a lot of processing of current data was done, as well as obtaining data from new and known sources. We have now taken advantage of this work to also develop a new version of our model to predict the condition and remaining life of building parts.
Retraining on new data
The previous version of the service life model was trained on residual lifetimes from our partners' past maintenance plans and reviews by external suppliers for the National Construction Fund. Our new model now includes, for the first time, data that our customers themselves have entered into the app in connection with new physical condition assessments of their properties and the creation of maintenance plans.
The new version of the model is trained on approximately 112,000 unique building parts from 9,600 buildings.
New input features
In addition to being trained on new data, additional input features have also been added that the model uses to provide predictions. The following are examples of new features:
- The roof and facade material of the building. In the previous model, they were only given as input when predictions of remaining roof and facade life had to be given, but since they are important parts of the climate screen (the protection of the building from external factors), they can also say something about the condition of other building parts.
- A numerical version of the energy label, so the model knows that A2020 is the best energy label and G the worst.
- A more detailed version of the building's use from BBR. In the previous version, we used exclusively the upper level, e.g. 'Buildings for year-round habitation', while we now use all three levels, i.e. also e.g. 'Row, chain or semi-detached house (vertical separation between units) 'and 'Double house'.
- What unit, the quantity of the building part is measured in, e.g. square metres, running metres or pieces.
- Commercial space from BBR.
- The area of the municipality in which the building is located, from Statistics Denmark.
- Whether the owner of the BFE number owns all of the property or only part of it, and whether they own the land.
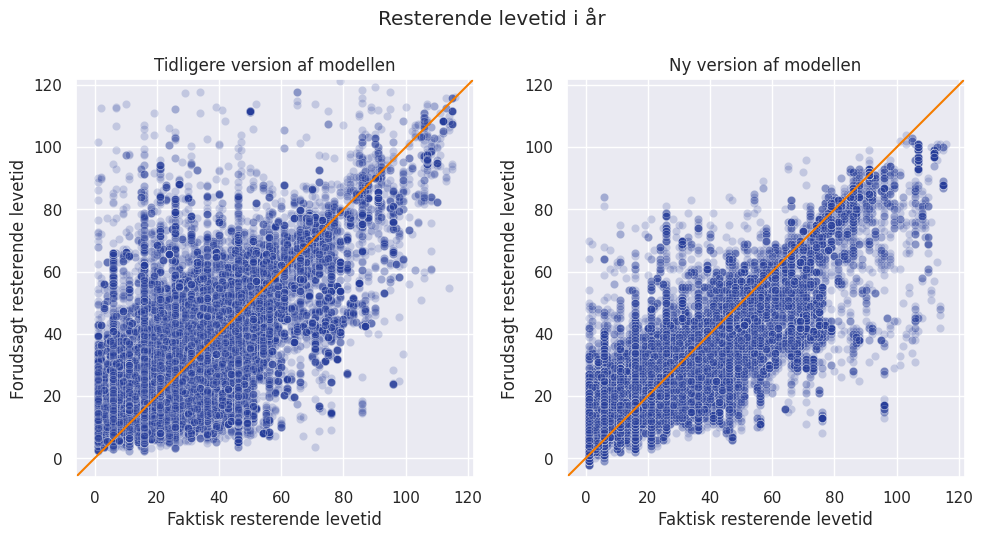
In the figure at the top of the post, the relationship between predicted and actual remaining lifetimes for the previous and new versions of the model, respectively, is plotted. The closer the blue points are located to the orange line, the better. The performance of the model has significantly improved and we will continue to work on improving it further.


Subscribe to our newsletter
Get insights into new features, customer cases, and news from proprty.ai, delivered straight to your inbox.
%202.webp)
